
Introduction:
All activities within the Financial Reporting Server are stored inside the FRLogging.log file, but unfortunently it is difficult for an EPM user to quickly exploit this file of thousands of lines to find relevant information and synthesize it. For a non-technical profile, it's even more difficult.
Logstash, Elastic Search and Kibana: Each of these three tools has a specific role in the workflow, allowing to pass from the flat log files to dashboards with graphs and statistics, and show synthetically the contents of the logs.

Logstash:
Logstash is an ETL that allows you to pull data from a wide variety of sources, it also gives you the tools to filter, manage, and shape the data so that it’s easier to work with. Logstash is an integral part of the data workflow from the source to Elasticsearch.
ElasticSearch:
Kibana:

Kibana is the latest tool in our suite ELK for analyzing application logs: the raw data is analyzed in Logstash, stored in Elasticsearch, but not yet usable.
Kibana is a web interface that will be connected to the Elastic search cluster to allow text queries in order to generate graphs (histograms, bars, maps...)
Filebeat:

Our Goal:
The purpose of this tutorial is how to use the ELK suite to generate graphs and dashboards of our EPM Financial Reporting activities.
To install the ELK suite, please refer to the documentation in the official website :
https://www.elastic.co
all the following modules must be installed:
Logstash: The server component of Logstash that processes incoming logs
Elasticsearch: Stores all of the logs
Kibana: Web interface for searching and visualizing logs
Filebeat: Installed on client servers that will send their logs to Logstash, Filebeat serves as a log shipping agent which uses the lumberjack networking protocol to communicate with Logstash
Prerequisites:
all the following modules must be installed:
Logstash: The server component of Logstash that processes incoming logs
Elasticsearch: Stores all of the logs
Kibana: Web interface for searching and visualizing logs
Filebeat: Installed on client servers that will send their logs to Logstash, Filebeat serves as a log shipping agent which uses the lumberjack networking protocol to communicate with Logstash
The following graphe describes the flow that each new line of our FRlogging.log file will perform :

Steps:
1- Configure Logstash to receive FRLogging.log file parse it then send data to be stored inside ElasticSearch:
the logstash.yml file to use:
input {
beats {
port => 5000
type => beats}}
#the input part used to defined in witch port the logstash will listen for logs
filter {
if [type] == "Financialreporting" {
grok {
match => { "message" => "\[%{TIMESTAMP_ISO8601:timestamp}\]%{SPACE}\[%{WORD:JVM}\]%{SPACE}\[%{DATA:severity}\]%{SPACE}\[\]%{SPACE}\[%{DATA:class}\]%{SPACE}\[tid\:%{SPACE}%{DATA:thread}\]%{SPACE}\[userId\:%{SPACE}%{DATA:userid}\]%{SPACE}\[ecid\:%{SPACE}%{DATA:ecid}\]%{SPACE}\[APP%{GREEDYDATA}REPORT\:%{SPACE}\[Start\:%{DATA}%{SPACE}%{DATA}\]\[End\:%{DATA}%{SPACE}%{DATA}\]\[Elapsed\:%{NUMBER:timeelapsed:float}\]\[Host\:%{DATA:host}\]\[JobId\:%{DATA:jobid}\]\[User\:%{DATA:user}\]\[Name\:%{GREEDYDATA:reportpath}\]\[InBook\:false\]%{GREEDYDATA:pov}" }}}}
#here we will filter the logs and parse them through the match module
output {
if "Elapsed" in [message] and "REPORT:" in [message]{
stdout { codec => rubydebug}
elasticsearch {
user => "elastic"
password => "xxxx"
hosts => ["localhost:9200"]
manage_template => false
index => "Financialreporting"
}}}
# once the log file is parsed, logstash will print the parsed lines into the console and send them to elasticsearch
the filebeat.yml file to use:
filebeat:
prospectors:
-
paths:
- E:\Oracle\Middleware\user_projects\domains\EPMSystem\servers\FinancialReporting0\logs\FRlogging*.log
# we use the * so the fiflebeat use all the FRlogging files.
input_type: log
document_type: Financialreporting
output:
logstash:
hosts: ["XXX.XXX.XXX.XXX:5000"]
shipper:
logging:
files:
name: filebeat.log
rotateeverybytes: 10485760 # = 10MB
level: info
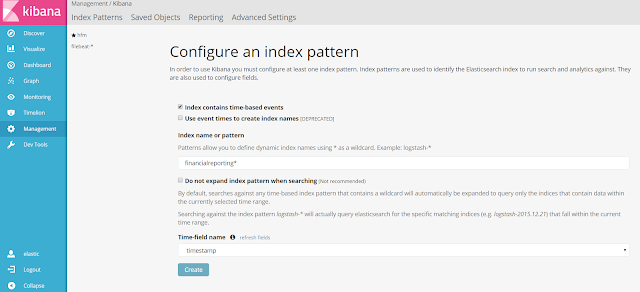
- before all, we have to create our index:
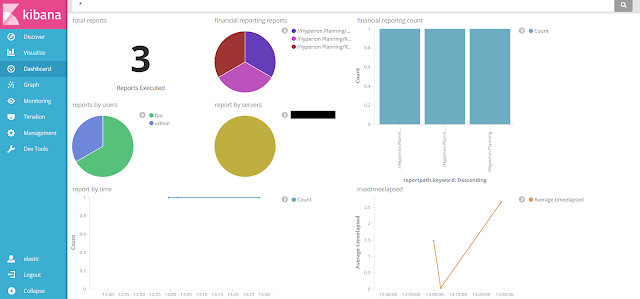
- then we can create our first dashboard using the Visualize tab:
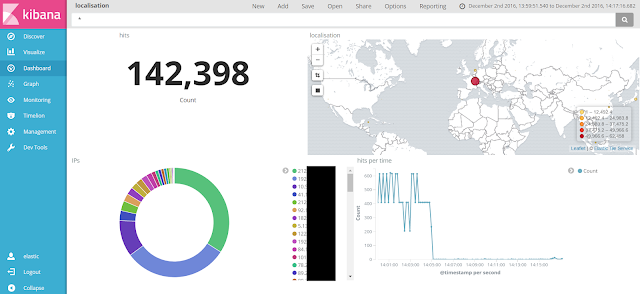
We can also use ELK with OHS and have some dashboard like the following :
output {
if "Elapsed" in [message] and "REPORT:" in [message]{
stdout { codec => rubydebug}
elasticsearch {
user => "elastic"
password => "xxxx"
hosts => ["localhost:9200"]
manage_template => false
index => "Financialreporting"
}}}
# once the log file is parsed, logstash will print the parsed lines into the console and send them to elasticsearch
2- Configure Filebeat in the Financial Reporting server to send the FRlogging.log content:
the filebeat.yml file to use:
filebeat:
prospectors:
-
paths:
- E:\Oracle\Middleware\user_projects\domains\EPMSystem\servers\FinancialReporting0\logs\FRlogging*.log
# we use the * so the fiflebeat use all the FRlogging files.
input_type: log
document_type: Financialreporting
output:
logstash:
hosts: ["XXX.XXX.XXX.XXX:5000"]
shipper:
logging:
files:
name: filebeat.log
rotateeverybytes: 10485760 # = 10MB
level: info
3- Use Kibana to generate our graphs:
- before all, we have to create our index:

- then we can create our first dashboard using the Visualize tab:

We can also use ELK with OHS and have some dashboard like the following :

Conclusion:
If you followed this tutorial, you should have a good understanding of how Kibana works. You should know how to search your log messages, and store them into elasticsearch to create visualizations and dashboards.
If you have any questions or suggestions, please leave a comment!
Good luck!